Data Analysis With Python的阅读笔记
Python EcoSystem: list of commonly used libraries
- pandas: The cornerstone of our Data Analysis job with Python.
- matplotlib: The foundational library for visualizations. Other libraries we’ll use will be built on top of matplotlib.
- numpy: The numeric library that serves as the foundation of all calculations in Python.
- seaborn: A statistical visualization tool build on top of matplotlib.
- statsmodels: A library with many advanced statistical functions.
- scipy: Advanced scientific computing, including functions for optimization, linear algebra, image processing and much more.
- scikit-learn: The most popular machine learning library for Python(not deep learning)
Falsy Values in Python - (numpy)
import numpy as np
import pandas as pd

falsy_values = (0, False, None, '', [], {})
any(falsy_values)

# Numpy has a special "nullable" value for numbers which is np.nan. It's NaN: "Not a number"
np.nan

# There are two functions: np.isnan and np.isinf that will perform the desired checks:
np.isnan(np.nan)
np.isinf(np.inf)

#And the joint operation can be performed with np.isfinite.
np.isfinite(np.nan), np.isfinite(np.inf)

# Square matrix
A = np.array([
#.   0. 1. 2
    [1, 2, 3], # 0
    [4, 5, 6], # 1
    [7, 8, 9]  # 2
])

A[:, :2]
'''
output:
array([[1, 2],
       [4, 5],
       [7, 8]])
'''
Linear Algebra
A = np.array([
    [1, 2, 3],
    [4, 5, 6],
    [7, 8, 9]
])
B = np.array([
    [6, 5],
    [4, 3],
    [2, 1]
])

A.dot(B)
'''
array([[20, 14],
       [56, 41],
       [92, 68]])
'''
A @ B
'''
array([[20, 14],
       [56, 41],
       [92, 68]])
'''
B.T
'''
array([[6, 4, 2],
       [5, 3, 1]])
'''
A
'''
array([[1, 2, 3],
       [4, 5, 6],
       [7, 8, 9]])
'''
B.T @ A
'''
array([[36, 48, 60],
       [24, 33, 42]])
'''
x = np.array([
		[1,2,3,4],
		[5,6,7,8],
		[9,10,11,12],
		[13,14,15,16]
	])
x.sum(axis=0) # remember: axis=0 columns; axis=1 rows
# output : array([28, 32, 36, 40])
Useful Numpy Functions
# random
np.random.random(size=2)
np.random.normal(size=2)
np.random.rand(2, 4)
#  arange
np.arange(10)
np.arange(5, 10)
np.arange(0, 1, .1)
#  reshape
np.arange(10).reshape(2, 5)
np.arange(10).reshape(5, 2)
#  linspace
np.linspace(0, 1, 5)
np.linspace(0, 1, 20)
np.linspace(0, 1, 20, False)
#  zeros, ones, empty
np.zeros(5)
np.zeros((3, 3))
np.zeros((3, 3), dtype=np.int)
np.ones(5)
np.ones((3, 3))
np.empty(5)
np.empty((2, 2))
# identity and eye
np.identity(3)
np.eye(3, 3)
np.eye(8, 4)
np.eye(8, 4, k=1)
np.eye(8, 4, k=-3)
"Hello World"[6]
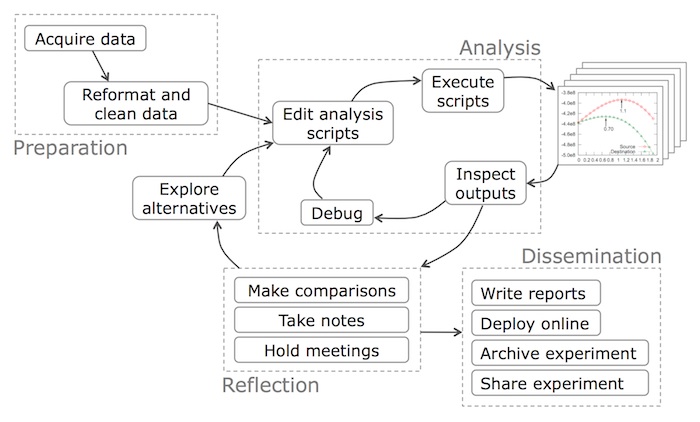
What does a Data Scientist do?
Getting the data
Depending on your company/organization, getting the data can be as simple as a SQL query or as difficult as scraping entire websites. The problem with this task is that it’s not standardized.
Parsing and Cleaning the Data
Depending on your sources, you’ll need to do a little bit of preparation. Excluding outliers, filling null values, translating values, etc.
Merging, combining data
If the data comes from different sources, merging it can be tedious. Specially if it’s hard to define that piece of information that relates different data sources.
Doing the analysis
This involves your own domain expertise + the tools available for the job. For example, you need to know the principles of statistics and you can also use statsmodels to simplify your job. The analysis part is usually iterative and involves other subtasks as visualizations, validation testing, etc.
Building models
The whole point of the analysis part is finding patterns in particular cases to build general models. Your models can be predictions, clusterings, or just automated reports. In a general sense, it’s the result of all the previous phases.
Deploying it
Perfect analyses and models are useless if they’re not repeatable and scalable. This phase depends on your own models, but it’ll usually imply a cloud provider. From simple reports (emailed every day at 3AM from an AWS Lambda) to a Machine Learning Model (built on top of Tensor Flow and deployed on Google’s cloud infrastructure).

Useful Links
FreeCodeCamp - Pandas Real Life Example
Interactive JupyterLab Tutorial